Reading and Creating Organizational Charts and Workflow Diagrams
Visualizing the stakeholders involved with the problem statement and their role in execution

The following is an excerpt from Part II in the NEW textbook Hacking for Defense, a graduate-level course taught at more than 70 colleges and universities worldwide and on three continents. More than 2,000 students have successfully completed its program.
A workflow is the repeatable pattern for how a specific task or group of tasks (e.g. processing information, providing services, or transforming materials) is performed. The workflow can be depicted as a sequence of operations, some mechanism, or the work of a person, group, organization, or staff. It can be used to describe the progression of a task from one step to the next, such as the transfer of a document, service, or product.
Workflows are critical to the process of finding a solution for the issues the Hacking for Defense course are solving for.
The benefit of creating a workflow is learning exactly how tasks are performed. Once the process of performance is mapped, the user will be able to identify where pain points exist within the process. In turn, identifying pain points in the problem will enable the user to recognize the beneficiariesBeneficiaries that face them. Selecting the most important pain points will allow a deep understanding of:
Where/When the pain manifests
Who is involved
What are the attributes of the pain
Developing a workflow will enable the user to describe the who, what, when, and where of the problem. Generating this learning is a prerequisite for explaining why the problem exists and exploring how it can be solved.
Put simply, creating a workflow will help answer two questions:
Who is the beneficiary? (more specifically, who will use the solution)
Which pain points of the problem should be focused on?
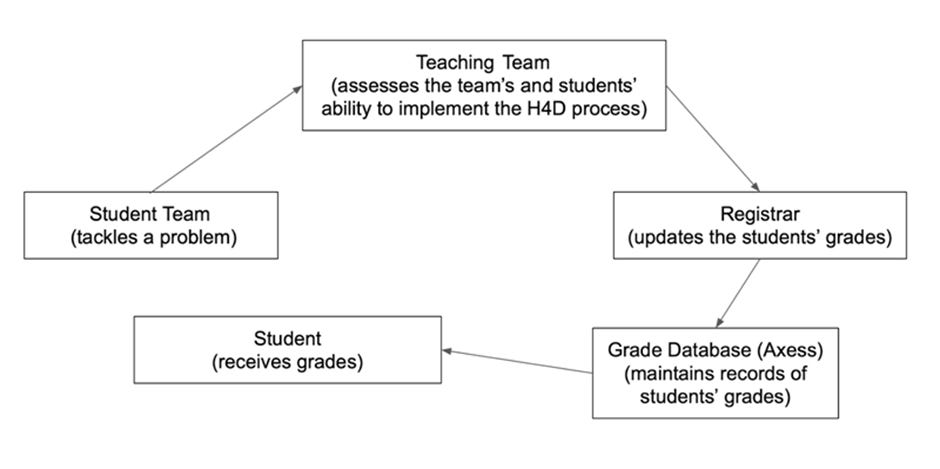
Most are likely familiar with the concept of a workflow, even if you haven’t developed one. For example, below is a workflow diagram for an H4D team’s grades (note that it is information that is being moved). The H4D workflow diagram indicates how information moves between entities and the role each plays in the H4D wider college/university ecosystem.
While this may seem abstract, you are already familiar with workflows. For instance, consider the following generic example of a workflow for a Hacking for Defense class.
This process will progressively deepen an understanding of the workflow as teams conduct Beneficiary Discovery. The workflow will become especially relevant when each team begins working on Value Propositions, because a good workflow will indicate the different pain points involved in the overarching problem that is being solved.
Pros
Creating a workflow will give practical insight into the execution of the work.
Tells specific people involved in the problem
Identifies pain points helping determine who is involved, when the pain exists, and what is needed to resolve
Cons
Don't know why problem is occurring
Don’t know how to solve
Therefore don’t know which pain points to concentrate on
Workflow Case Study: Team Fleetwise - Discovering where pain points exist
Seymour Johnson Air Force Base vehicle maintenance personnel are responsible for over 550 vehicles. Managing the repairs for all of these vehicles requires collecting and analyzing repair data, such as when a vehicle is sent in for maintenance, what repairs are needed, and where the vehicles are in the maintenance pipeline. Team Fleetwise was asked by the Air Force 4th Logistics and Readiness Squadron to help Fleet Management and Analysis (FM&A) controllers quickly and easily ascertain the functionality of vehicles across their fleet in order to prioritize repairs.
Team Fleetwise created an org chart. As the team validated their understanding of the organizations involved in vehicle maintenance, they also created a workflow diagram to understand what work was being performed and how it was being performed (i.e. How did the Air Force go from noting that a vehicle needed to be repaired to repairing and putting the vehicle back in the fleet?).
To accomplish this learning, Fleetwise created a workflow diagram from their interview notes and online research and used it as an MVP. The workflow MVP showed how information was processed from the mechanic all the way up to the highest levels of the Logistics Readiness Squadron. The goal was to understand the responsibilities of each position, the steps involved in facilitating fleet management, and identify the most critical steps in the process, along with bottlenecks. This is what they came up with:
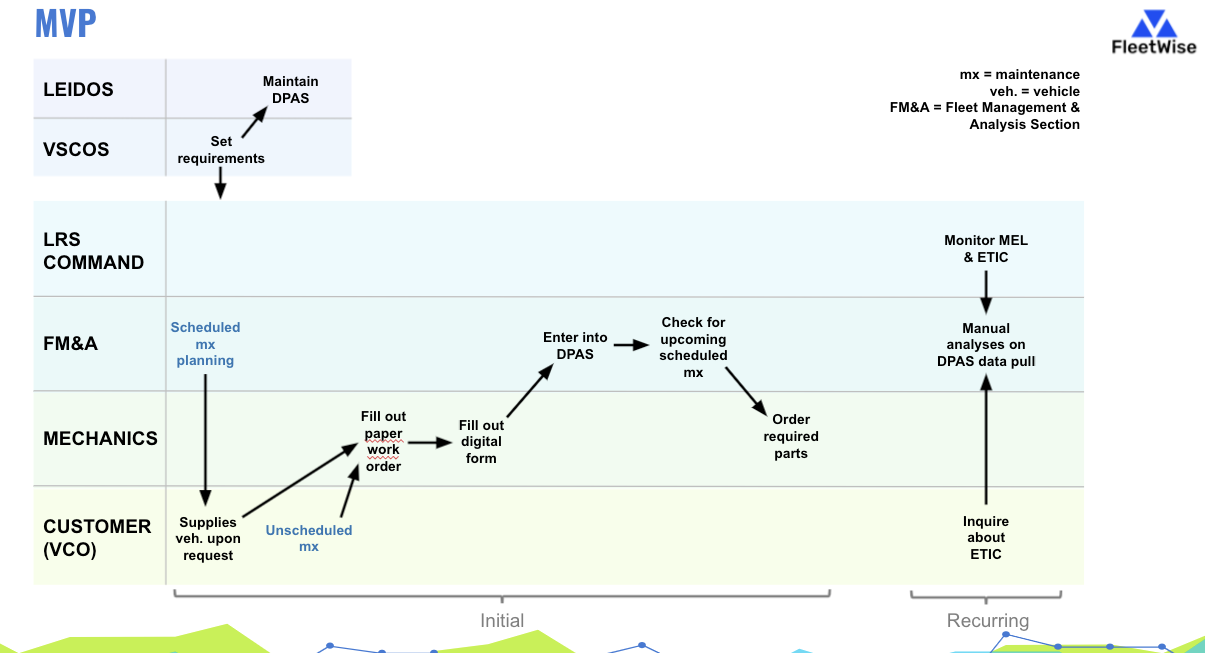
The workflow diagram Fleetwise created depicted how data on a vehicle was transmitted through the organization. The bottom left corner of the workflow begins with someone handing over their broken vehicle to the mechanics. Mechanics then fill out forms and send them to FM&A controllers who prioritize which tasks mechanics perform. Mechanics then order parts and repair the vehicle. Fleetwise also documented the databases used by various organizations in the workflow on the right hand side.
While the workflow was helpful, the team still didn’t know which specific problem they were solving or for whom. The team thus used this workflow diagram as an MVP they showed to interviewees to better understand the pain points in the workflow. The team made a point to ask questions like, “Which tasks correspond to your position? Which is the most tedious, difficult, or complex? Why?” Fleetwise found these questions to be more effective at eliciting emotions from day-to-day work than questions like “What do you think (about this diagram)? From their feedback, they were able to pinpoint bottlenecks and pain points in the whole fleet management process, which they highlighted in red in the workflow diagram below.
After a dozen interviews, Fleetwise identified several pain points various stakeholders experienced in the workflow.
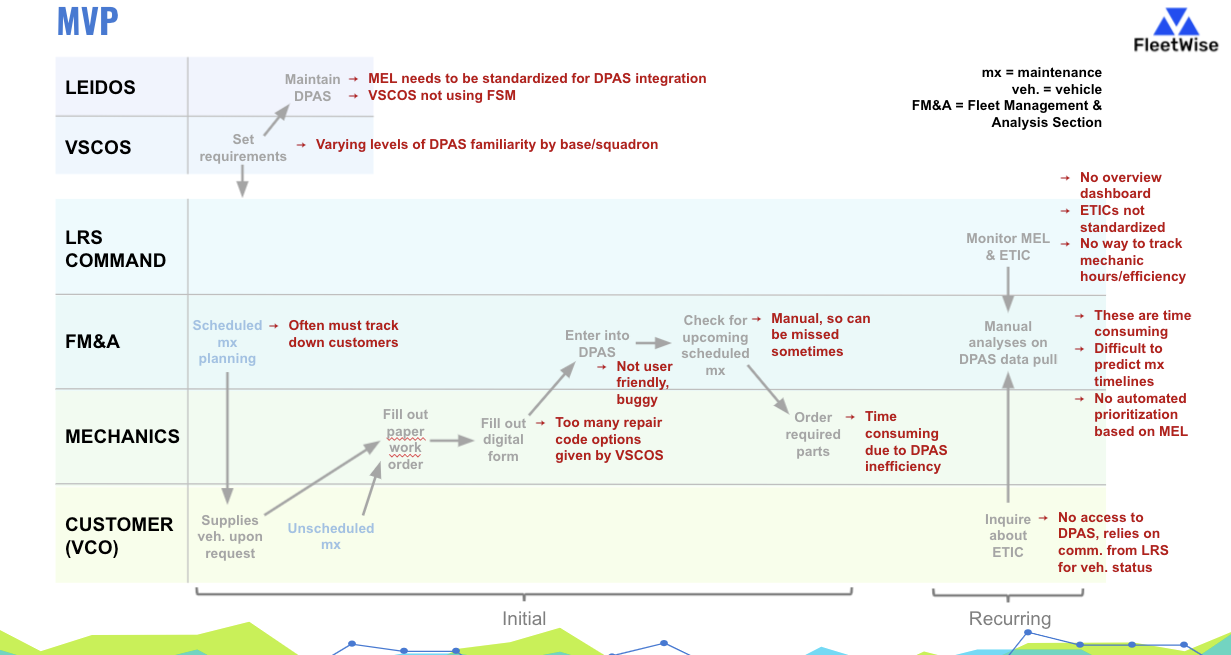
While the chart itself may be difficult to follow without the 5+ weeks of prior learning that went into it, the important takeaway is that the process of mapping workflow helped Fleetwise determine how and where their problem statement manifested in workers’ lives. The team gradually built up their MVP by using the Hypothesize – Design Experiments – Test – Learn Framework. Ultimately, they designed a tool to be used by both fleet controllers and commanders. It featured an overview of Key Performance Indicators along with graphs and summary stats that could be broken down by category. It also offered the ability to deep dive into individual work orders to determine vehicle maintenance bottlenecks and resolve them.
Task: Creating your workflow diagram
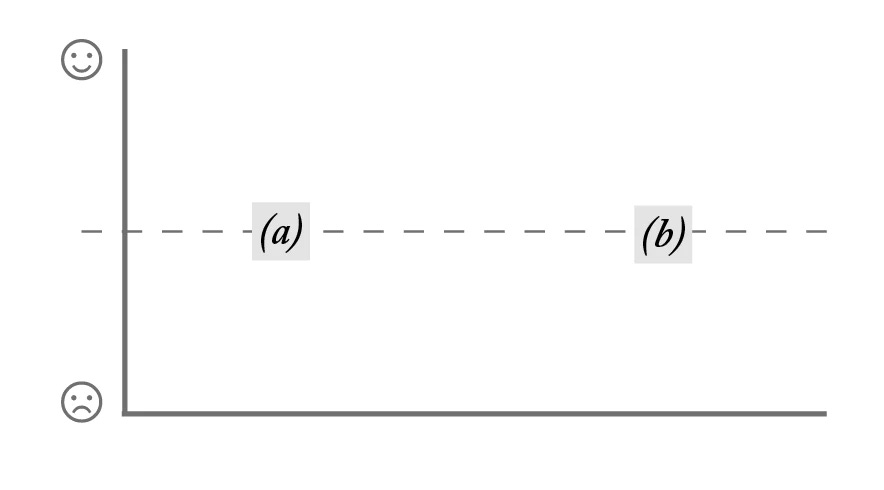
1. Draw the following on a large surface and label (a) and (b):
(a) The first moment a specific Beneficiary engages with the problem. When, for example, SEAL medics cannot track SEAL diver vital signs.
(b) The final outcome your Beneficiary is aiming for. For example, keeping SEAL divers healthy.
Origin: Building Great Customer Experiences, Colin Shaw, 2002
2. Write the following steps on post-its. What are the steps your Beneficiaries take before engaging with the problem (i.e. “a”), during the problem (i.e. between points “a” and “b”), and afterwards (i.e. “b”). Hint: Noting the activities with sticky notes is helpful because you can then move them around after you’ve plotted out all of the tasks.
3. Collect and put all the sticky notes along the dashed line in the order they occur.
4. As a team, decide which sticky notes represent the biggest pain points by moving them above or below the dashed line. Those that are moved below the line highlight important pain points that might be worth solving.
5. Once you identify the most pressing pain points between the start and endpoints, determine which are ideal to test. Like the Beneficiary exercise in the previous chapter:
Use a whiteboard to draw a Priority Map with 'Impact' and 'Effort' on the axes (see below). Ensure that it’s large enough to fit the most important of your “painpoint” post-its.
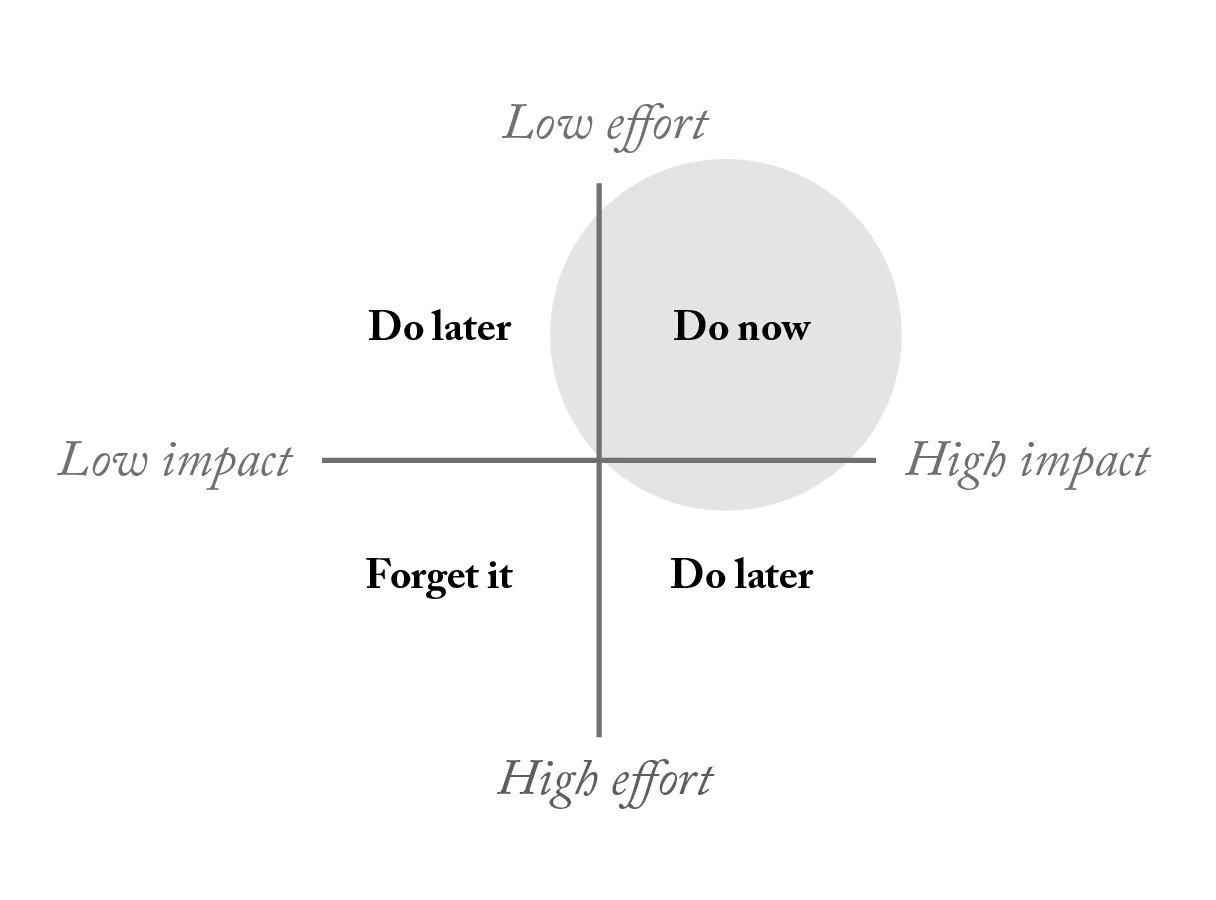
Origin: Dwight D. Eisenhower, 1954
After interviewing people about the pain points, add more detail to the workflow. By mapping the workflow of how the problem occurs for the Beneficiaries, the team can start identifying users' level of pain at any given stage. Doing this helps see how the experience can be improved by resolving pain points which may solve the problem for the Beneficiary.
An initial workflow will look like a series of steps as shown below in one team’s workflow MVP.