
TT4D: How to Effectively Complete a Quad Chart for Government Research Projects
by Jeff Decker, PhD and Nilay Papila, PhD Technology Transfer for Defense, Stanford University

How long do people watch a TikTok or Instagram reel, YouTube or movie trailer content before swiping right? Not long. Attention is a commodity. The same applies to researchers wishing to capture a program manager’s attention with the value of a research project.
Companies use something called an “elevator pitch.” An elevator pitch is a brief 30-second introduction to a company or product. It sets the tone and conveys one or two key points that can be clearly understood in the time it takes to ride an elevator. The goal is to engage the listener and hook them into wanting to continue the conversation.
The quad chart is an elevator pitch for the research world. The goal is to communicate the value of a research project so program managers (PMs) are motivated to learn more.
Because decision-makers rely heavily on this document during funding reviews, it is essential to approach its preparation with precision and care. Below is a step-by-step guide to help researchers craft an effective quad chart while avoiding common pitfalls.
What is a Quad Chart?
A quad chart is a concise one-page document highlighting a specific research project. It gives researchers an opportunity to succinctly convey the concept, value, goals, and progress of the work. The chart is divided into quadrants where each is dedicated to articulating a specific aspect of the research project: 1) start/end dates, 2) The individuals involved in the research, 3) research objectives and 4) milestones and accomplishments.
Why use a Quad Chart?
A compelling quad chart will help secure or retain funding from a PM. PMs use quad charts to quickly assess research projects to determine if the research aligns with their program goals. If so, the PM will request additional information such as a white paper or full proposal. The quad chart is a critical first step in obtaining funding for your research. Quad charts are also used by PMs to assess ongoing research projects.. PMs use quad charts to stay updated on a project's progress and use their content to brief their bosses.
Layout Overview
Each of the four quadrants serves a distinct purpose. Researchers must familiarize themselves with each of the quadrants to concisely convey the value of their research.
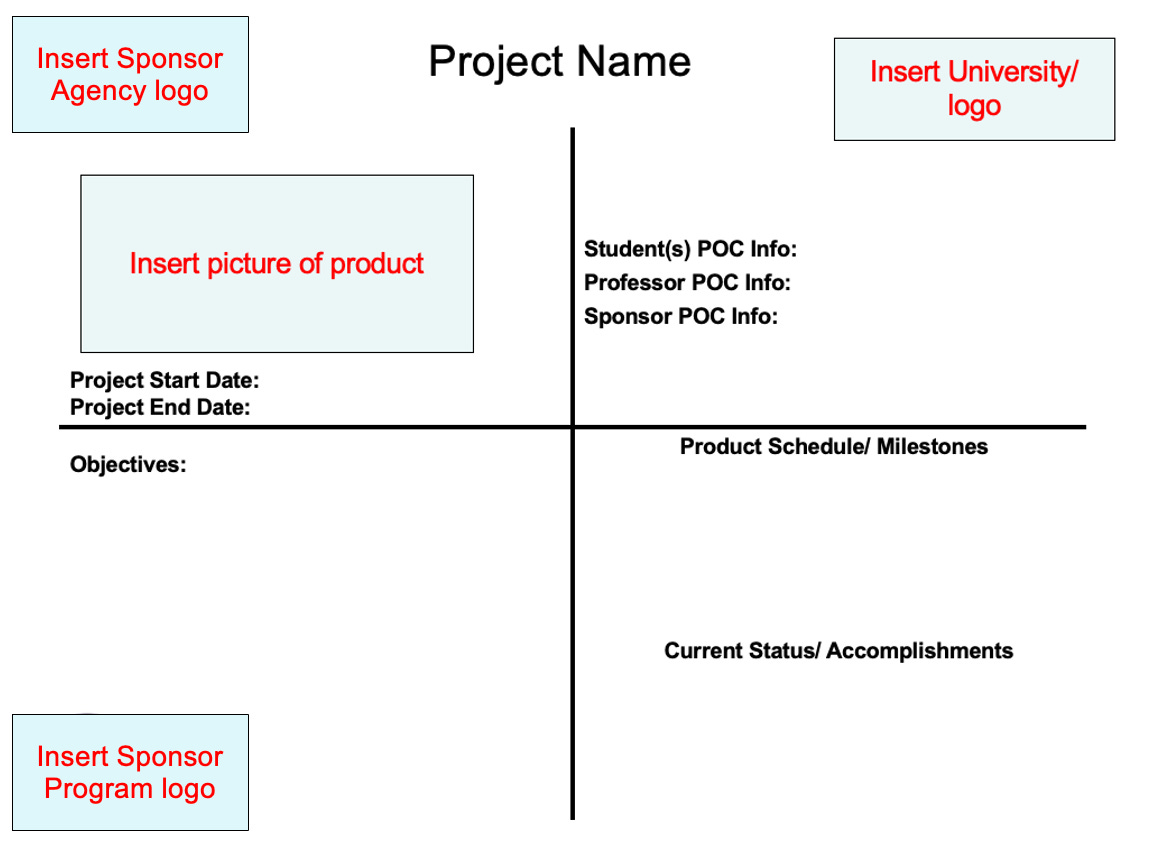
The top-left quadrant is an opportunity to visually hook the reader with an image. The image will be the first thing they will see so it should be visually engaging and understandable. Depicting research prototypes, simulations, or other compelling images will serve this purpose. Avoid technical diagrams or overly detailed visuals, and instead choose a clear image that conveys the essence of your work. Include the start date and anticipated end date under the image.
The top-right quadrant provides details about the research team. List the key members including students, professors, and government collaborators – their roles in the project, affiliation, and contact information.
The bottom-left quadrant focuses on the project’s objectives. This section should outline research goals in simple, clear terms that align with the funding organization’s mandate and priorities. For instance, “The goal is to develop a sodium ion battery with x times the state-of-the-art (SOA) cycle life and 550-750 Wh/L energy density to increase the endurance and longevity of naval undersea vehicles.” Make sure the objectives are actionable and quantitative. Avoid vague or overly broad statements like “to innovate energy storage systems” and instead focus on specific, achievable goals. Linking your research to Army, Air Force, or Navy priorities is essential. See this post for more.
Finally, the bottom-right quadrant should detail the project’s schedule, milestones, and current status. This section includes a high-level timeline, major milestones, and recent accomplishments. For example, highlight items like “Prototype testing has been completed with 20% higher efficiency compared to existing models. If appropriate, consider using a Gantt chart or bullet points for clarity. This quadrant provides the PM and reviewers with a clear assessment of progress and demonstrates that the project is on track. For projects that have not been funded, this quadrant should contain the specific milestones that must be met to achieve the research objectives.
List any prestigious awards or accolades a researcher has won to demonstrate the research project’s value.. This information establishes the impact and collaborative nature of the research project. Be concise and ensure all contact information is accurate and up-to-date.
Tips for Creating a Compelling Quad Chart
Consider the value: Articulate the novelty of your research project. What makes it different from the state-of-the-art? What makes it important?
Tailor the content: Consider who will read the quad and why they should support it.
Align each quadrant to support a common message: The timeline of the project and research team should be aligned to the goals and milestones of the project. The objectives and the impact of potential results should be clearly stated and be proportionate to the timeline, personnel, and budget.
Focus on the value it could provide: Explain how your research can directly address the needs and priorities of the PM’s organization.
Common Mistakes to Avoid
When preparing your quad chart, there are several pitfalls to avoid. A cluttered layout can overwhelm reviewers, so ensure your content is well-organized and easy to read. Avoid adding excessive text or visuals, as this can dilute your message. Unclear objectives can undermine your proposal’s credibility. Approach the quad chart with a “less is more” mentality with the goal to hook the reader into wanting to learn more. Make sure your goals are specific and directly tied to the funding organization’s mandate and priorities. Outdated information, such as old POC details or milestones, can hurt your submission, so double-check that all content is accurate and current. Quadrants should support each other.. For instance, the start/end time should be proportionate to the research objectives and the milestones sought.
Final Checklist
Before submitting your quad chart, review it thoroughly. Ask yourself the following questions:
Is the layout visually balanced or are quadrants crowded or underutilized?
Does the image in the top-left quadrant compellingly and effectively represent your project?
Are all point-of-contact details accurate and easy to find?
Is the content provided tied to the funding organization’s priority?
Are your objectives clearly stated, specific, and quantitative?
Is the schedule/milestones quadrant concise and up-to-date?
By addressing these questions, you can ensure your quad chart will succinctly make a strong case for funding your research.
Conclusion
In the competitive landscape of defense research, a well-crafted quad chart can be the key to securing and continuing funding for your project. It is not just a summary; it is a reflection of your project’s value and potential impact. A thoughtfully prepared quad chart demonstrates to reviewers that you understand DoD priorities and are capable of delivering impactful results.
By following this guide, you can create a quad chart that is both informative and visually compelling. This document is your opportunity to make a strong first impression and communicate the value of your research.. A great quad chart can set your proposal apart, showcasing your project as a valuable investment for advancing defense technology.
________________________________________________________________
Technology Transfer for Defense (TT4D) at Stanford University specializes in matching Defense Department funding with academic research projects. In the past six years, TT4D has worked with numerous faculty members at more than a dozen universities to help them win Defense Department grants and with the Office of Naval Research, totaling more than $13 million, to support research funding and transition academic technologies from lab to defense capabilities. TT4D is based at Stanford University and is run by Jeffrey Decker, PhD, program director, Precourt Institute for Energy, Fu-Kuo Chang, professor of Aeronautics and Astronautics, and Nilay Papila, PhD, senior program manager, Precourt Institute for Energy. To contact the TT4D team, visit techtransferfordefense.stanford.edu.
To read previous TT4D posts, see:
TT4D: Tech Transfer for Defense's 4-Step Guide to Winning Defense Department Research Funding
TT4D: How to Find Existing Research Broad Agency Announcements
TT4D and Researchers Looking for Government Financing $$$: Prepare and Submit Your Application
TT4D: Maximizing Your Event's Impact with Army Conference Support
TT4D: Frequently Made Mistakes in Research Proposals: What to Avoid for Success